ChE 1101 Fall 2005
NASA has a number of projects with bioreactors. They are developing them to metabolize human waste (solid, liquid, and gas) on spaceships into breathable air, water, and fertilizer for plants. To read about one of these bioreactors, visit the following website: http://science.msfc.nasa.gov/newhome/br/bioreactor.htm.
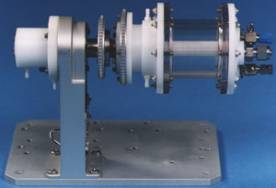
A new spin on cell growth
NASA is meeting the challenge with a unique new technology, the
rotating wall vessel bioreactor. It spins a fluid medium filled
with cells to neutralize most of gravity's effects and encourage
cells to grow in a natural manner. The rotating bioreactor was
invented by NASA as a model for microgravity effects on cells.
All living populations go through stages of growth, which is depicted in the following graph.
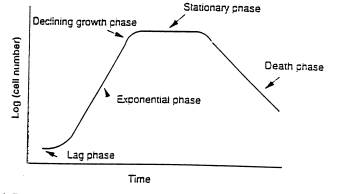
Think about each stage of growth and match the phase with its definition.
| _____1) Lag | a) Cell number and weight increases rapidly. |
| _____2) Exponential | b) The number of forming cells is equal to the number dying cells. Existing cells live off of dwindling food supply and by metabolizing the dying cells. Toxins have built up in the environment and are beginning to interfere with cell function. |
| _____3) Declining growth | c) Time it takes for cells to adjust to their environment before beginning to metabolize the food. |
| _____4) Stationary | d) Cells run out of food and the population crashes. Toxins have built up to a lethal level and cells die rapidly. |
| _____5) Death | e) Cell growth starts slowing down due to the environment getting crowded and many cells are competing for the food. |
 We
are going to monitor these phases of growth in a bread yeast
population in a tiny bioreactor. From the discussion in class,
we learned that mass is conserved in every process. In
this experiment, we have 2 processes: the cellular process and
the bioreactor itself. For the cellular process,
it is necessary to understand that cells eat food and excrete
waste. Food in our system is going to be sugar, which the
cells take in and metabolize to CO2, ethanol, and hydrocarbons. We
are going to monitor CO2 production by watching how much gas
is produced from our reactor.
We
are going to monitor these phases of growth in a bread yeast
population in a tiny bioreactor. From the discussion in class,
we learned that mass is conserved in every process. In
this experiment, we have 2 processes: the cellular process and
the bioreactor itself. For the cellular process,
it is necessary to understand that cells eat food and excrete
waste. Food in our system is going to be sugar, which the
cells take in and metabolize to CO2, ethanol, and hydrocarbons. We
are going to monitor CO2 production by watching how much gas
is produced from our reactor.
EXPERIMENT:
Lay out your materials for your bioreactor on your lab mat.
Step 1. Weigh out 0.2 grams of yeast using weighing paper on the scales and carefully pour this into your bioreactor (erlenmyer flask). Weigh out the amount of sugar your group has been assigned and add that to the bioreactor. Record these amounts on the Results Page.
Step 2. Fill your bioreactor with 50°C (~120°F) water to the 75 mL line (milliliters are the same as cc’s or cubic centimeters which are also written cm3). Record this amount on your Results Page.
Step 3. Stir rapidly with your stir bar until all the yeast and sugar is dissolved. Push the stopper with the bubbler in it into the bioreactor flask until it is snug.
Step 4. Start your timer now.
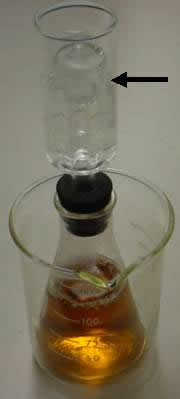
Step 5. Remove the cap from the bubbler apparatus on the top of the bioreactor. Using your squirt bottle, fill the bubbler with water up to the line marked with the arrow in the photograph above.
Step 6. Place the entire bioreactor (flask and bubbler) inside the temperature bath (beaker). Fill the beaker to the 250 mL mark with warm 50°C (~120°F) water. Place the thermometer in the bath and record the temperature on your Results Page.
Step 7. Your bioreactor is now together. On your Results Page, record the time of each bubble and the temperature. You may plot the results as you go on the chart provided.
Results Page
Step 1:
Exact weight of yeast, Wy = ___________ grams
Weight of sugar, Ws: Ws = __________ grams
Step 2:
Weight of 50°C water added, Ww:
Amount
of water added = ________ mL
Density
of water = 1 gram / mL
Total weight of water added, Ww =
___________ grams
What is the total mass entering the reactor?
WT
= ______________ grams
Step 4:
Bubble # |
Timer |
Temperature |
initial |
0.00 |
|
1 |
|
|
2 |
|
|
3 |
|
|
Questions:
Rate of bubble production can be determined from your raw data
or from your graphs. This is the number of bubbles produced
over a period of time. Locate the 3-minute period of time
in which the number of bubbles produced was largest. Use
this to calculate the maximum bubble production your biomass
showed.
Maximum bubble rate, Rmax = ____________________bubbles
/ sec
What growth phase was this?_______________________________
Use the same strategy to determine the minimum bubble rate.
Rmin = _____________________bubbles / sec
What growth phase was this?_______________________________
Graph your temperature results:
What was the rate of cooling (calculate from temperature data)?
Rcool
= ________________________°C/sec
Bioreactor Memo & Results: Write up a 2 page discussion of your results, observations and conclusions. Please include plots of your data. How could a chemical engineer improve the design of these bioreactors to improve results and increase yield?